Introduction
The Claims
Analysis
Comment
Costs and Benefits
At the present time there is great demand for measures designed to reduce traffic speed, particularly in urban areas, in the belief that this will improve road safety. Campaigners will often point to reductions in accident rates after such measures have been introduced previously and say this proves their case. But there is an obvious flaw in such argument: accident rates have been falling steadily for around 50 years, long before traffic calming or speed cameras were invented. In fact, rates of accident reduction in the UK tailed off around 1990, just when traffic calming, speed cameras etc. came into widespread use!
Data is from a House of Commons report which also includes graphs for deaths and all casualties, but mysteriously omits the above graph of KSI (persons killed or seriously injured), which is generally considered the most important measure. The figures for deaths are particularly striking, having virtually flatlined between 1993 and 2007. The real reasons for falling casualty numbers are probably mainly due to improvements in vehicle design and driver training plus, I would suggest, reductions in drink-driving. Also, "deaths" means up to 30 days after the crash, and improved medical care may prevent or postpone death meaning the casualty is merely a KSI. Incidentally, it is important to bear in mind fluctuations in traffic levels when considering these figures, but that is beyond the scope of this article.
London-specific graphs since 1972 are available in TfL's report on Collisions and casualties on London’s roads 2008 (p59-60), along with a whole host of summary statistics.
I have for some time been rather suspicious about these claims, as well as being concerned about the adverse side effects of the schemes, so decided to investigate. What follows relates largely to 20mph zones and other traffic calming schemes in London, but similar considerations probably apply in other areas of the country (and world!) as well, and to some extent to speed cameras, traffic lights and other things.
Studies have often claimed to show significant reductions in accident rates as well as traffic speeds and overall traffic flow in 20mph zones. Most individual schemes are accompanied by an impact assessment, usually based on a simple before-and-after comparison, but there have been some larger and more scientific studies. Two have been commissioned by Transport for London:
Review of 20mph Zones in London Boroughs – TRL 2003
20 mph zones and road safety in London – LSHTM 2008
The TRL report basically assembles before-and-after data for lots of schemes. The LSHTM study uses a more sophisticated time series analysis which purports to show a step change in accident rates, although exactly how this is derived is not explained.
These reports are often referred to in comments such as "research has shown that 20mph zones save lives." In fact this research shows nothing of the sort – these studies are okay as far as they go, but the only conclusion that can reliably be drawn from them is that accident rates fell within the zones, during the period for which data was available. Note, for example, that it says nothing about the effect of reducing speed limits without traffic calming measures, as is now being implemented by a number of London boroughs. Indeed, both reports specifically caution against such conclusions being drawn. TRL: "However, the results also leave many questions unanswered and so it is recommended that further work is undertaken to assess the potential benefit of more extensive use of 20mph zones." LSHTM: "There is some evidence that relative isolated 20 mph zones are more effective in reducing all casualties compared to surrounded 20 mph zones. ... 20 mph zones are still having an effect on road safety, but the effect appears to be smaller in more recent years. ... There is a need for more information to inform our understanding of how 20 mph zones affect exposure, in changing the travel patterns of road users, particularly cyclists." "We also cannot predict whether the effects of 20 mph zones on casualties would change substantially if large areas of London became 20 mph zones. Findings ... indicated that isolated 20 mph zones have greater casualty reduction effects compared to surrounded 20 mph zones. This suggests that the predicted casualty reductions from the scenarios may be overestimated. ... However, the vast majority of casualties take place on roads that are unsuitable for a 20 mph zone intervention. So any strategy based on 20 mph zones alone would have limited effect on casualty reduction in London as a whole."
The before-and-after approach has a number of fundamental flaws:
1) Background trend: As mentioned above, the background rate of casualty reduction needs to be taken into account. This is relatively straightforward to deal with, but interestingly both these reports use a long-term background trend for this purpose, which is dominated by a long period during the 1990s when casualty rates barely fell at all, giving a low overall background rate (12% over 5 years in TRL, and 1.7% in LSHTM). However, in fact the background rate increased markedly from 2001 to about 10% year-on-year, and as this covers the period when most of the 20mph zones being considered were evaluated this is the figure that should have been used. I have no idea why there was such a sharp change in the trend, but it has been fairly uniform across London, so it would be wrong to attribute it to the 20mph zones themselves. So, surprisingly, it seems that neither report deals with this issue satisfactorily. This is probably less of an issue in the LSHTM report due to the time series technique used, but they do not give sufficient details of how the technique is applied to check this point.
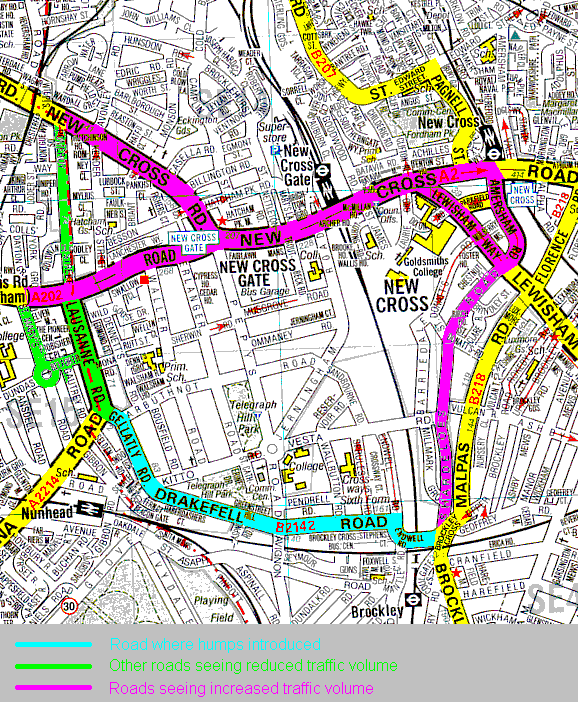
2) Accident migration: whilst there may well be benefits within a 20mph zone, there will be an impact over a much larger area. Some reasons for this are covered in the comment section below. A fair chunk of the reduction in accidents in zones is simply due to a reduction in traffic levels, although relatively little data seems to have been collected on traffic volume; but it would be somewhat odd if there were not a corresponding rise in accidents on the roads that the traffic has diverted onto. Accurately quantifying this effect is impossible, so it is simply ignored, or at best assessment is limited to roads on the edge of the zone. TRL looks only at the boundary roads, and LSHTM uses a larger 150m band – the assumption clearly being that displaced drivers will simply drive round the edge of the zone. But this is not realistic – it is likely that many drivers will avoid the area altogether, thereby actually providing benefits on the boundary as well – as indeed LSHTM found to be the case, without offering any explanation. But in reality, the negative effects, though small, will extend for miles*. More comprehensive traffic flow data would be very helpful here. An interesting related point is that as more 20mph zones appear in an area, with an increasing number now on main roads, traffic will divert back into the original zones!
|
* As an example familiar to me, Drakefell Road in Brockley SE4/SE15 had humps added many years ago. The main alternative route is via Shardeloes Road - Lewisham Way/Amersham Road - New Cross Road. This route is almost entirely more than 150m from Drakefell Road.
|
3) Novelty bias: Considering only the year or three years immediately after scheme introduction is atypical, as users will gradually adjust to the new arrangements and start taking bigger risks over time. "Familiarity breeds contempt." No study I have read has even acknowledged this point. (Apparently, studies HAVE shown that almost ANY change to road layouts etc. leads to a reduction in accidents initially, while users get used to the new arrangements. I have not been able to verify this claim but it seems highly likely.) Most of the data used for both the TRL and LSHTM studies was for schemes that had only just been implemented, so there was no way this effect could be taken into account. However, it is notable that later studies are finding lower benefits than earlier studies; this could well be simply because later studies include a higher proportion of "mature" schemes. It would be interesting to revisit schemes after, say, 10 years – something which could now be done.
4) Regression to the mean: Schemes, especially the earlier ones that the studies looked at, are often installed in locations with a history of accidents (TRL confirms this). For one thing this means that the results cannot automatically be applied to other areas which may not have such a history. More importantly, this "history" may be due to statistical variation rather than inherent dangers, and hence a reduction would be expected regardless of whether anything is done. This is called "regression to the mean" (RTM). TRL and LSHTM both attempt to address this, in very different (and both fairly crude) ways, but "find no clear evidence" rather than disproving anything. Indeed, the figures in LSHTM do actually suggest that at least 5%age points of the reduction is due to RTM – this is dismissed as not significantly significant on the assumption that there is no RTM, but this is a rather odd assumption when some RTM is only to be expected! The only way to address this properly is to conduct a randomised controlled trial – that is to say, identify potential schemes in the normal way, but then select only half of them, at random, for implementation, and assess all in the same way.
In summary, then, there are some serious issues with the approach, which no study I have looked at has addressed in a satisfactory way. How serious these issues are is unknown. In my judgement, points 2 and 3 have the most serious statistical implications. Either way, both TRL and LSHTM have failed to allow for all four phenomena, and therefore their conclusions are of little value in assessing the question of whether 20mph zones are helpful to reducing overall casualty rates. To be fair, these factors would be very hard to quantify, but there is an alternative method ...
One very simple approach I have not seen tried is to compare the overall performance of whole boroughs, which have widely varying policies, ranging from no humps at all (Bromley, Barnet) to 20mph on all roads (Southwark, Islington). In a few cases policies have changed, such as in Croydon where humps were favoured earlier but are now being removed. Accident figures since 2003 are available at a borough level on
http://www.tfl.gov.uk/corporate/publications-and-reports/road-safety
and figures for the 5-year period 1994-1998 were available from a previous report, Towards the year 2010:
monitoring casualties in Greater London, which I will use as the baseline as it broadly represents the pre-traffic calming world.
This approach avoids the inherent flaws of scheme-based studies, as it considers the overall success of each borough's approach on the same basis over quite a long time period, including schemes in all different stages of introduction, and includes the knock-on effects of schemes on the roads outside them. The only problems I can see are:
1) There may be reasons other than road safety policy that affect the trends from borough to borough, such as new roads, population changes, and modal split and shift. For example, Newham and Barking & Dagenham will have benefited from completion of the A13 upgrade. In particular, it is evident that accident rates have fallen faster in outer London, whereas most 20mph zones are in inner London – but it would be wrong to assume that one is the result of the other. I have addressed this issue at the end.
2) What one borough does could have an effect on neighbouring boroughs, especially near borders. Introduction of traffic calming is likely to displace some accidents to neighbouring boroughs, but, as it turns out, the neighbouring boroughs have still done better!
3) (Not a limitation of the approach, but of the data available): A small number of traffic calming schemes had already been installed by 1998. However it was only from 2000 onwards that traffic calming and 20mph zones really took off.
4) 20mph zones and traffic calming schemes have tended to be installed on mainly quieter roads where there are fewer accidents anyway, so the impact on borough-level figures would not be expected to be huge. LSHTM contains a table (14) showing the number of accidents that occurred (in 2006) in existing or potential 20mph zones. The categorisation of roads as "suitable" or otherwise is rather crude, but is a reasonable approximation to the situation at that time. The data showed that 79.6% of casualties and 81.2% of KSIs were on "non-suitable" roads, that is to say Motorways, A-roads and "non-residential" roads. Furthermore, of course, by no means all "suitable" roads have been treated, though it must be close to 100% in some boroughs (and even some A-roads are included these days); across London, 1118 out of 6355, or 17.6%, of casualties on "suitable" roads in 2006 were on roads already treated. Thus any benefits of speed reduction in 20mph zones would only ever apply to around 20% of casualties, so a 50% reduction in casualties in those areas would equate to around 10% across the borough as a whole (reduced in proportion to borough coverage). Incidentally, in the scheme-based studies, it would make sense to use the background trends for these "suitable" roads rather than using the total figure.
I have compiled figures both for KSI (persons killed/seriously injured) and deaths, as well as total casualties. The figures for deaths alone are really too small to be statistically reliable, even if aggregated over a few years. Even for KSIs, large fluctuations can be observed in some boroughs. I have drawn up a comparison between the earlier 1994-1998 period and 2013-2017, the latter calculated from the yearly figures. There tend to be fluctuations across London from year to year, which are generally thought to be mainly a result of variations in weather; calculating over 5 years gives a more consistent result.
I have crudely categorised the boroughs as having low (<10%), moderate and high (>30%) proportions of 20mph roads using the data here:
https://www.whatdotheyknow.com/request/20mph_zones_in_london
http://londontransportdata.wordpress.com/2011/08/03/update-on-20mph-zones-in-london/
The London ISA Map (2009) may help to visualise this. Whilst I am not fully familiar with all boroughs, I believe the proportion of 20mph zones broadly reflects the proportion of traffic calming generally. Most early traffic calming schemes were introduced without reducing the speed limits, but in many cases this has been done subsequently. Conversely, since 2014 a number of boroughs have applied 20mph speed limits to most or all of their roads without any traffic calming, but as these schemes are generally agreed to have a minimal impact on traffic speeds this has been ignored.
In addition to totals for London, totals are given for Inner and Outer London separately. Note that I have defined inner London as purely those boroughs which border on central London, thus excluding Greenwich, Lewisham, Hammersmith & Fulham and Wandsworth which are officially inner London boroughs but undoubtedly have traffic characteristics more typical of outer London. This categorisation also gives a much more consistent radius, of 3-4 miles, from Charing Cross than the official definition. (Greenwich is not in "inner" London by any stretch of the imagination!)
Technical note: The TfL casualties report mentions that a revised and more accurate method of reporting serious injuries was introduced in September 2016. This means that some injuries previously classed as slight are now regarded as serious. This has resulted in KSI figures jumping up in both 2016 and 2017. Additionally, online reporting was introduced, which is assumed to have resulted in a higher proportion of casualties being reported and thus the small increase in total casualties, though of course there was never any data on the number of non-reported casualties so this is only guesswork. All this does mean that the figures are no longer directly comparable with previous years, but as this change presumably affects all boroughs in the same way, it should not affect the methodology of this study.
Killed/Seriously injured
Deaths only – NOTE highly susceptible to statistical variation.
All casualties

[Excel version, also including some additional figures and analysis]
The headline figures for casualty reduction are:
| Level of traffic calming | Reduction for | ||
|---|---|---|---|
| Deaths | KSIs | All | |
| Low | 48.48% | 63.00% | 38.06% |
| Moderate | 48.31% | 63.14% | 33.80% |
| High | 48.99% | 57.45% | 28.84% |
It will be seen that there is very little difference between the categories in the figures for both KSIs and all casualties, with in fact the correlation being the reverse of what is generally claimed. Despite these figures being so close, they are statistically significant (i.e. there is enough data to be reasonably sure that this is not a fluke). Of course, correlation does not prove causality, so I should caution against reading too much into these results. The differences between boroughs are almost certainly due to other underlying factors not covered here, particularly the inner/outer London issue. The only conclusion that can safely be drawn from this analysis is that the bulk of the reduction in accidents in London has got nothing to do with the introduction of 20mph zones. This is nonetheless important, given that the majority of the road safety budget has been spent on such schemes.
Whilst the figures for deaths only do come out slightly more favourable for intervention, even after categorisation the results are still not statistically significant. A single major accident can cause differences of as much as 5 percentage points in the number of deaths. This illustrates why the KSI statistics are generally regarded as the most useful and important.
Not directly relevant to this study, but it is perhaps a bit odd that KSIs have fallen by so much more than either deaths or total casualties. One might have expected deaths to have fallen by more than KSIs. Some might say this is a result of only KSIs being specifically targeted, but it is hard to see how you can specifically improve KSIs without improving deaths or total casualties.
Graphs help to illustrate the long term trends, showing the fairly consistent patterns between the three different categories. A chart showing traffic volumes against the 1994-1998 baseline is added to give context - source: DfT table TRA8901. As noted above, the jump in KSIs in 2016/2017 was due to a change in the way severity of injuries is categorised.
Meanwhile it is now possible to plot accident reduction rates against the proportion of zones in each borough, so that the (weak) negative correlation can be visualised. This is comparing 1994-1998 with 2008-2012 (i.e. not updated with 2013-17 data).
Possible geographical bias
One possible explanation for the poor performance of boroughs with high levels of traffic calming could be that they are mostly located in inner London, where overall levels of accident reduction have been lower. I have therefore split the analysis by Inner and Outer London. Certainly, there would appear to be some truth in this theory, but the differences are still clearly there for KSIs and total casualties. (The results for deaths alone are inconsistent, presumably due to low data values.) Concentrating on KSIs, the results are:
| Level of traffic calming | KSIs Reduction for | ||
|---|---|---|---|
| Inner London | Outer London | All | |
| Low | 52.64%* | 66.20% | 63.00% |
| Moderate | 57.84% | 64.30% | 63.14% |
| High | 54.23% | 60.49% | 57.45% |
The results for Inner London are not statistically significant with the exception of the Moderate category; those for Outer London are significantly significant with the exception of the Moderate category. I suspect none are significant in reality, but crucially, the advantage you would expect to see in highly traffic calmed areas is still not visible (proportion of accidents in "suitable" roads × proportion of such roads actually converted × claimed rate of accident reduction in converted roads ~= 20%×50%×50% = 5%).
Graphs again:
It would be an interesting question as to why the trends are different in inner London. This has occurred despite motor vehicle traffic levels falling quite significantly (up to 30%) in the inner London boroughs, but being more constant in outer London (see earlier graph, and the spreadsheet contains figures per million vehicle miles).
I suspect that it is fundamentally because there are more pedestrians and cyclists in inner London. It is probably the case that their number is increasing proportionately faster there than elsewhere. It may also be because casualty rates are falling faster amongst vehicle occupants, who are protected by developments in vehicle technology, than amongst the more vulnerable pedestrians and cyclists. Another factor could be the high proportion of tourists in central London – likely a factor in the jump in casualties in 2012, during the London Olympics.
It is also worth noting that the increase in walking and cycling is largely a result of the same set of policy initiatives that gave us 20mph zones. So if the poor results in inner London are a result of this, it is only right that a single figure for the whole of London should be considered anyway. Note, again, that this increase will also have affected the inner London boroughs that have not adopted 20mph zones, but they have done better nonetheless.
In fairness, outer London is not a homogeneous lump either, but it is not possible to further subdivide the boroughs in any geographically meaningful way. If the raw data were available, this problem (and any other form of borough-related bias) could be overcome quite easily by dividing London into rings strictly by distance from Charing Cross, and then manually subdividing the rings into suitable segments depending on the local 20mph situation.
This conclusion will probably seem counter-intuitive to most people, used to being fed a diet of "speed kills." So let's examine some of the reasons why focusing on speed may be counterproductive. I live in an area (Lewisham) where many 20mph zones have been introduced and have closely monitored their effects "on the ground".
One point worth making before starting is that people (both drivers and observers) tend to under-estimate vehicle speeds in terms of mph by quite a large margin – as much as a third. The correct conclusion from this is not that people are driving too fast (although they may be), but that the numbers we associate with different speeds are inaccurate. The consequence is that when people say there is a problem with speeding in an area, they tend to assume the solution is to reduce the speed limit, whereas the problem in fact is usually that the existing 30mph limit is being exceeded, in which case we should surely be improving compliance with the existing limit rather than reducing it (see further detail in box below). Contrary to popular belief, many cyclists can and do exceed 20mph – and even 30mph for that matter.
The case for reducing speed, generally, is in fact a largely intuitive one, based on two considerations:
1) If a potential collision situation arises, it will be easier to avoid crashing if vehicle speeds are lower. This is no doubt true, although impossible to quantify, as there is no data for situations when a collision is indeed avoided.
2) If a collision does occur, the severity of any injuries will be reduced. A frequent comment is that research has shown that a pedestrian has a 90% chance of surviving an accident at 20mph, as against 50% at 30mph. This is not actually correct – the true figures are 98% and 93% respectively* – although the inference may be similar.
|
* The quote appears to be a misunderstanding of a report commissioned by the DfT in 2010. What the report actually says is that 90% of deaths involve impact speeds of 20mph or more and 50% involve speeds of 30mph or more, which is a totally different consideration. It is salutory to note how this error has ended up being repeated in most recent road safety reports, and in particular by councils promoting 20mph schemes, showing how poorly their authors research their facts – it would appear they are only interested in nice soundbites! For what it is worth, at 40mph the figure is dramatically worse at 69% – suggesting that 30mph strikes a sensible balance on typical urban roads. As an aside, the same report also explodes the myth that children are more likely to be killed in a collision. It is actually the elderly who are at most risk. The survival rates at 30mph are 96% for 0-14 year olds, 95% for 15-59 year olds and just 53% for the 60+ group. Note, incidentally, that:–
It would also be more useful to have equivalent figures for KSIs rather than just deaths – annoyingly, the study already uses this data, but only calculates the risk curve for deaths. † This observation is supported by research quoted in TfL's Pedestrian Safety Action Plan, which analysed pedestrian fatalities over a 5 year period. Vehicle speeds are given:
Interestingly, the research proposes countermeasures that could have prevented each accident. Reduced speed limits are only proposed for 2 out of 195 deaths, and traffic calming for 5. Speed enforcement was suggested in 28 cases – suggesting that more often the existing limit was appropriate but exceeding it was a problem. The most common countermeasure however was improving pedestrian awareness for 77 deaths, reflecting the fact that the pedestrian was deemed wholly or partly at fault in 146 out of 197 cases. | |||||||||
These considerations are fine, but they only tell you part of the story. In essence, it may be statisically true that driving faster is more dangerous, but it does not follow that reducing vehicle speeds in a given situation will result in greater safety, because various underlying factors are at play. The problem is that these underlying factors are less obvious, so people tend to forget them; but no proper analysis can afford to do so.
In relation to (2), these figures only tell you the risk of survival for a given impact speed: they tell you nothing about the risk of an impact, or the relationship between the impact speed and the approach speed or the speed limit. It is to be expected that a vehicle will slow down considerably before impact. An impact speed of 30mph implies an approach speed of around 40mph; if vehicles abide by a 30mph speed limit then it is probably impact speeds of 15-20mph that are most relevant. Regarding the first point, introducing a 20mph zone will affect (almost certainly increase) the number of potential collision situations, so at least the following factors would also need to be quantified:
3) The more slowly you drive, the longer you will be on the road, and therefore the larger the number of road users (of all types) you will encounter during the journey.
4) Traffic calming measures are themselves a hazard. They cause erratic driving and cycling and can lead to people losing control. They often force people onto a potential collision course. Humped pedestrian crossings distract drivers so that they are less likely to see the pedestrians. Overtaking a bike travelling at 15mph (say) takes far longer at 20mph than at 30mph, and is consequently more dangerous.
5) If vehicles travel more slowly, then they will take longer to clear any bit of road space. This reduces the time that is available for crossing the road or making tricky manoeuvres, forcing people to take bigger risks. The extent to which this is an issue depends on how busy the road is. I have created a simulator which suggests that, under representative conditions on a typical main road, the safe crossing time is reduced by about a quarter to a third. This is simplistic – in practice, with traffic calming vehicles often speed up and slow down unpredictably, meaning it is far harder to judge gaps in traffic. Bear in mind that a 20mph zone does not mean vehicles travelling at 20mph, especially where traffic calming is involved. Humps slow some vehicles to 5-10mph, and chicanes can lead to queues of traffic waiting to get through.
6) That people are allowed to drive at 30mph does not mean they will do so when there is any danger. Most drivers are quite good at slowing down when there is. If the speed limit is lower than the safe speed, it places an extra burden on the driver to ensure compliance with the limit, requiring regular checks of the speedometer – vehicle speeds can change very quickly at low speeds, and maintaining a steady 20mph is quite a skill. From the driver's perspective, this is therefore simply a distraction from the task of driving safely.
7) Speed reduction measures may lead people into a false sense of security, for example pedestrians walking near or on the carriageway. Pedestrians often think they have priority to cross roads when they do not – indeed many schemes are designed to encourage this, in the hope of slowing vehicles down, which is fine ... until both pedestrian and driver think they have priority.
Studies such as those of TRL and LSHTM, which look at the impact of specific interventions, will already take these factors into account. But this approach still has limitations as outlined earlier, and the data needed to complete the story is simply impossible to collect. Neither approach takes proper account of:
8) As an extension of (7), vulnerable road users encouraged to take bigger risks in traffic-calmed areas may take similar bigger risks in areas without traffic calming.
9) Contrary to popular belief, most accidents occur on main roads – see p20 of the 2nd link on this page. Traffic calming typically encourages people to divert off safe low-congestion "residential" routes onto relatively unsafe congested main roads (most of which are themselves residential, of course). Furthermore, in my experience, there are far more vulnerable road users on main roads than local roads. Think about it from the driver's perspective: overall route mileage is likely to be similar, but following a main-road route you will meet far more other roads users of all types. The design of main roads may make the risk of a collision with a specific road user less likely, but this is probably outweighed by the much larger number of other road users encountered.
Note: The official definition of a "main road" includes only Motorways and A-roads, which is clearly pretty absurd at least in a London context. Most B-roads must surely be considered as main roads, as would many C roads and even some unclassified roads. There is nothing particularly scientific about these classifications; any sensible analysis that attempts to categorise the roads should be based on the number of vehicles per hour using the roads.
As noted above, about 80% of KSIs occur on (official) main roads. Yet only about 62% of traffic flow is on these roads, and they make up only 12% of total road length in London . See:
www.tfl.gov.uk/cdn/static/cms/documents/traffic-note-1-traffic-levels-in-greater-london-2010.pdf
This is as one would expect, as a higher traffic flow means not only more vehicles, but more other vehicles (and quite likely other road users) for each vehicle to interact with.
10) Traffic calming is often introduced as part of a wider objective of reducing car use. This may make sense in transport terms, but in pure safety terms it makes no sense to switch people onto modes, particularly cycling, which are inherently dangerous. If people switch to bike they are exposing themselves to greater risk for the entirety of their journeys (noting in particular that London cyclists are at relatively little risk from cars, most fatalities arising from collisions with lorries, which will always be there). From the TfL report, the breakdown of the deaths in 2017 was:
Car/taxi users 14
Motorcyclists 31
Cyclists 10
Pedestrians 73
Bus/coach passengers 2
Goods/Other 1
It will be seen at once that numbers of pedestrians, cyclists and motorcyclists killed are out of all proportion to the distance travelled by those modes, so in safety terms it is quite irresponsible to encourage their uptake.
11) Traffic calming and unnaturally low speed limits could result in drivers becoming more stressed (see 6), making them less safe for the remainder of their journeys. (I have always thought the term 'traffic calming' to be rather a misnomer!) I have no particular evidence for this, but LSHTM states quite explicitly: "Psychological traffic calming aims to slow speeds by increasing the cognitive load of the driver ..." This sounds like a Really Bad Idea. Interestingly it is the flip side of the "false sense of security" point I have deployed in (7), but vehicle drivers are likely to be on the road for longer, and have to deal with far more such interactions than pedestrians, so the cumulative negative effects are far greater.
12) Drivers who are in a hurry may resort to taking much bigger risks to obtain a faster journey.
13) If speed limits are artificially low it may encourage drivers to treat them as a target speed, which could actually result in them driving faster than they otherwise would in "real danger" situations. Intelligent Speed Adapation (whereby vehicle speeds are controlled by referring to a digital speed limit map) can only exacerbate this problem, as drivers simply put their foot to the floor and go as fast as the system allows them.
14) Focusing on speed diverts attention from the real issues, such as drivers, cyclists and pedestrians not concentrating or following the rules of the road. Real policemen catching people for real dangerous driving have been replaced with cameras catching people for breaking the law. The Met Police re-introduced some traditional traffic policing during 2013 (mainly in inner London), and this could well be the reason for the big drop in KSI accidents that year.
15) Slower traffic pushes up bus operating costs and reduces TfL's ability to improve bus services, which would help to reduce car traffic and presumably improve road safety. Already, I estimate, something like a hundred extra buses have been added to the London bus fleet to counter the effects of traffic calming. Think of how many new routes could instead have been introduced with these buses!
16) There are probably lots more factors I have not thought of. For example, if a speed hump damages my car, I may have to make several trips to the dealers for repairs, potentially generating more accidents on the way! This might sound silly, and is pretty minor in the overall scheme of things, but you can't just ignore it.
Note that these later points 8-16 will all potentially result in accident migration dispersed over a large area, which the TRL/LSHTM studies fail to take into account. Indeed, my approach does not fully take it into account either, as in many cases the effects will go well over borough boundaries; the difference is that my conclusions occur despite this, not because of it.
With the exception of 8, 11 and 16, these considerations (3-16) are all either simply facts, or things which can be observed happening in existing 20mph zones. Are these factors important? Individually, they might be fairly marginal, but there are rather a lot of them. I do not know what the overall effect is – I can only speculate. But the point is that nobody actually knows, because nobody has even attempted to investigate; I doubt that it is possible to quantify any of these effects accurately enough to be any use, let alone all of them.
This is why I believe looking at the borough level data is a better approach to use as a starting point. My analysis clearly demonstrates that something is wiping out any genuine benefits that there might be within the zones themselves. Remember, we would expect to see reductions of around 5% better than the average in boroughs with "high" levels of calming, but this is not the case even when inner and outer London are separated. These suggestions give some pointers as to what the reasons for this might be – although there is still room for other underlying statistical factors.
It should be possible to develop this approach given more detailed information about individual accidents, so that the various underlying factors can be taken into account, such the number of vehicles, cyclists and pedestrians using the road, and the different trends for different road user types. This approach should allow more meaningful conclusions to be drawn. On the other hand, the more complex the methodology, the more assumptions have to be made, and the more likely there are to be errors and oversights in the analysis (as with the TRL and LSHTM studies), and the smaller amounts of resultant data may not be statistically significant anyway.
All this is of course without considering the very obvious disbenefits of traffic calming, humps in particular. Humps can directly cause injuries such as back pain, especially for bus passengers, and they also damage vehicles. They also delay emergency service vehicles – some years ago the London Ambulance service suggested this could result in as many as 200 "extra" deaths per year (more than the total number of deaths in accidents!). Driving at lower speeds and constant acceleration and braking also cause additional pollution, leading to further illnesses and deaths – note that there are roughly 10 times as many deaths in London from traffic-related pollution as from traffic accidents. In my experience, there are also increases in intrusive noise pollution. Slower traffic means more congestion, further increasing pollution and reducing economic productivity.
There is also cost. Based on recent costings published, just installing 20mph limits across an entire borough costs about Ł3-5M, and traffic calming is said to cost around 50 times as much – that is around Ł100 million and Ł5 billion respectively for the whole of London. This is a one-off cost, but there are ongoing maintenance costs, and increased costs to all road users resulting from longer journey times. I have estimated that the cost to TfL of buses abiding by a London-wide 20mph limit, if implemented, would be between Ł300M and Ł500M p.a.*, so the total economic cost is bound to run into billions of pounds. Then there is the opportunity cost: if boroughs spent less on speed reduction they could spend more on the trickier tasks of redesigning dangerous junctions or other genuinely beneficial safety measures.
|
* The graphs below show the distance against time curves for a typical bus trip between two bus stops (or traffic lights) 300m apart under free flowing traffic when restricted to either 30mph or 20mph. These curves are based on TfL bus specifications of a maximum acceleration of 1.5 m/s2 (acceptable range is 1.2-1.7), which is 3.35mph/s. Maximum jerk (rate of change of acceleration) is specified as 0.5 m/s3. The transit time between the two stops is 34s and 42s respectively – 24% longer in the 20mph limit, which is less than the theoretical maximum of 50% (30/20-1) because of time taken accelerating and braking. To get a feel for the impact on the overall journey time, a bus stop dwell time of 14 seconds has been added, so the total time increase is from 48s to 56s, a 17% increase.
Note how most of the distance is covered whilst driving at the speed limit - not much distance is covered whilst accelerating and braking. It takes 3 minutes to drive 1 mile at 20mph and 2 minutes at 30mph, so the extra time required to complete a round trip (in minutes) could in theory be anything up to double the route length (in miles), typically around 15-20 minutes. This is, of course, simplistic, as buses are by no means always able to reach 30mph even in free flowing traffic, and more time may be spent stationary than the model allows. On the other hand, stops may be further than 300m apart. Equally, if traffic calming is used, maximum speed may be as little as 10mph in places. As a check of my modelling, the overall speeds work out at 13.98mph and 11.99mph respectively, which actually is quite realistic; current average off-peak speeds outside central London are typically 10-12mph, which in addition to the factors above reflects various speed reduction methods already in place. Additionally, lower speeds mean more general congestion, although this is hard to measure. Overall, then, an increase of between 15% and 25% in journey times is quite likely. As the total cost of operating the bus network is roughly Ł2 billion, this equates to an extra Ł300-Ł500 million. |
Any sensible appraisal of safety schemes needs to assign some sort of cost when a collision occurs, so as to set it against the costs of measures that might prevent the collision occurring. The DfT has figures used for this purpose, which have been worked out semi-scientifically although do also include a large subjective "human cost" element. These vary slightly depending on road type, but the average figures in 2011 are shown in the table below. This is given with the number of London accidents of each type in the same year to give a total cost.
| Type of accident | Cost per accident | Number of accidents (2011) | Total cost |
|---|---|---|---|
| Fatal | Ł1,877,583 | 159 | Ł298,535,697 |
| Serious | Ł216,203 | 2,646 | Ł572,073,138 |
| Slight | Ł23,136 | 26,611 | Ł615,672,096 |
| Total | Ł1,486,280,931 | ||
| Damage only | Ł2,027 | 315,738* | Ł640,000,000* |
The most optimistic analysis, such as that by TRL and LSHTM, shows reductions of around 40% where 20mph zones with full traffic calming are used. Applying this figure to the total gives a potential benefit of Ł595M p.a. Whilst this would relatively quickly cover the direct infrastructure costs, it most certainly would not cover the wider economic costs – although those are normally ignored, even though the DfT accident cost does take into account wider economic factors such as loss of tax revenue from the deceased.
Furthermore, as noted earlier, around 80% of accidents occur on "main" roads (the breakdown by seriousness is not known). Limiting the benefits to "minor" roads therefore reduces the potential benefit to Ł119M. Then, the 40% figure seems hopelessly optimistic; the maximum I would find believable, having weighed the evidence, is around 10%. This gives a benefit of Ł30M. If, as is now usual, the 20mph limit is applied without enforcement (generally agreed to yield a reduction of only 1mph in actual average speeds), the accident reduction may be as low as 1% giving benefits of just Ł3M.
Personally I'm not a great deal affected by traffic calming as most of my travel is by rail. My concern about this subject is twofold: one, this country seems to be sleepwalking into accepting, and spending large amounts of money on, a set of ideas that are intuitive but false, and actually seem to have the opposite effect to that intended; and secondly, as a firm advocate of good bus services and an industry insider, I see the enormous damage done to bus service provision and reliability by the introduction of traffic schemes. Bus journey times in London continue to rise by 1-2% per year, despite overall traffic levels falling, and I believe this is almost entirely due to the way the road network is being managed. There is much talk about a 20mph London-wide limit, and this alarms me enormously – bus services may have to be cut by 20-30%, unless a massive increase in subsidy is forthcoming. My hope is that people will read this article and start to think critically about what they are being told, rather than just accepting conventional thinking.
Initially published on 28 November 2013
Improved versions published on 29 November, 2 December 2013
Finalised version published on 5 December. Only very minor changes to text, plus HTML code alterations.
Updated 3 July 2014 following publication of accident figures for 2013. No changes were needed to the main conclusions, although some of the commentary was improved. Sub-headings were also added.
Updated version published 12 March 2015 with greatly expanded commentary, following some critical comment and further investigation of the literature.
Updated 15 June 2015 following publicatin of accident figures for 2014. Again, no changes needed to the main conclusions. All altered text in green.
Distance/time graphs added 16 June 2015.
2015 figures added 24 October 2016
2016 figures added 8 January 2018
2017 figures added 2 January 2019